BARAZA PRESS RELEASE · NOVEMBER 3, 2026 | ||||||||||||
The Election Day
|
House +20 Democratic seats 234 D · 201 R | Senate +5 Democratic-aligned seats 52 D-aligned · 48 R | Governors +2 Democratic governorships 26 D · 24 R |
Projected seat gains versus the current-seat baseline—not changes since the previous forecast. Senate includes Democratic-aligned independents; governors include all 50 states.
A national forecast.
A local view.
November 3, 2026 — Baraza today released its Election Day update to Baraza Predictions, its public election forecasting experience powered by Maya. The forecast covers all 435 U.S. House districts, 35 Senate races, and 36 governor races, with an interactive national map and state-level race details.
The updated model projects 234 Democratic and 201 Republican House seats, up from its October 27 projection of 231 Democratic seats. Its central Senate projection remains 52 Democratic-aligned seats and 48 Republican seats. Across all 50 governorships, including offices not up for election, the projection remains 26 Democratic and 24 Republican.
Six Senate races to watch.
The November 3 forecast favors Democrats in Texas, Michigan, Ohio, Maine, and Kansas, while Iowa remains a toss-up with a narrow Republican lead. The cards below show projected margins, candidate win probabilities, polling benchmarks, and uncertainty ranges.
TexasU.S. Senate 
|
|
MichiganU.S. Senate 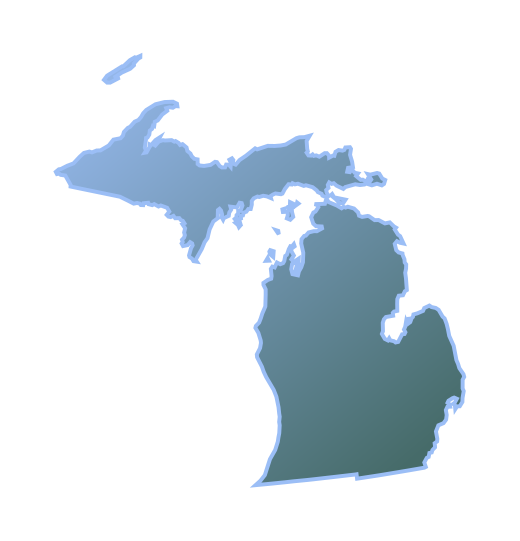
|
|
OhioU.S. Senate 
|
|
Special election; the model treats this seat as open.
MaineU.S. Senate 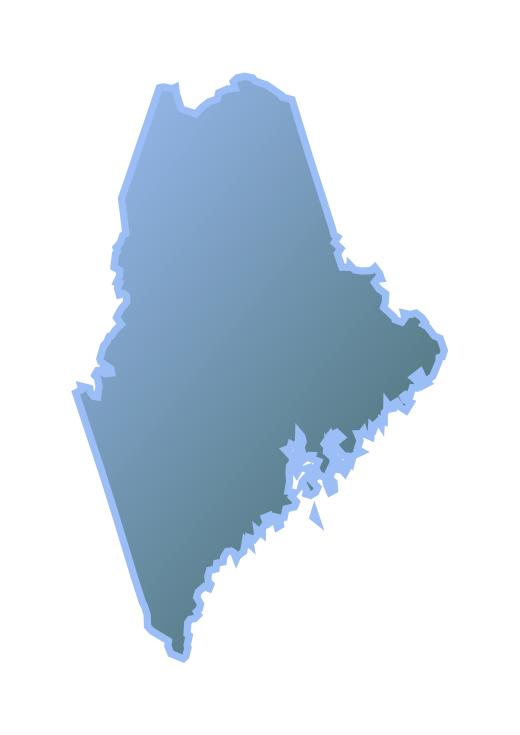
|
|
Maine uses ranked-choice voting; this is a two-candidate projection.
KansasU.S. Senate 
|
|
IowaU.S. Senate 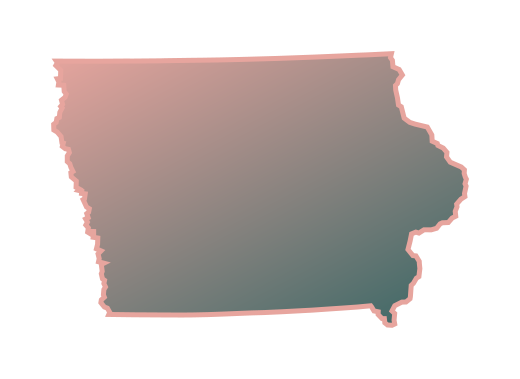
|
|
What changed.
Since the October 27 snapshot, the update changes projected margins in 487 races, win probabilities in 318 races, polling averages and counts in 68 races, and ratings in 34 races. The House projection rises by three Democratic seats; the Senate caucus and governor headlines remain unchanged.
Six races change favored party: Arizona’s 2nd, Colorado’s 3rd, Florida’s 25th, and Pennsylvania’s 1st move from Republican to Democratic favorites; Maine’s 2nd and the Georgia governor race move from Democratic to Republican favorites.
How to read the numbers.
The workbook’s national headline projections come from 20,000 joint simulations. The House headline is a seat median; the Senate headline is a Democratic-aligned caucus median that includes independents counted with Democrats. The website also presents separate Senate party expectations, rounded to 50 Democrats, 48 Republicans, and two independents.
Governor totals combine the 36 races up for election with 14 offices not up. Projected gains in the opening graphic compare with the current allocation; they do not describe changes since the previous forecast.
Projected margins are percentage points between the two candidate columns. Win probabilities estimate the chance of winning, rather than projected vote share. Some contests use a two-candidate model for ranked-choice or multi-candidate elections. Polling averages are shown as a separate benchmark. Forecasts are estimates, not election results.
About Baraza
Baraza builds software for campaign teams, bringing contact management, fundraising, call time, events, and team workflows into one workspace. Baraza Predictions provides public forecasts for the 2026 U.S. House, Senate, and governor elections, powered by Maya.
Press contact
Baraza team
hello@getbaraza.com
See the whole picture.
Explore Senate, House, and governor forecasts.
Compare the model with the polling benchmark.